Most traders use candlestick charts to watch the markets advancement but not all of them know how to use them in their trading by taking advantage of candlestick patterns. There are many ways to use these patterns and create simple systems that will help you identify the direction of the market.
Candlesticks show the close, low, high and opening price of a stock, currency or index over a time frame. The period of the time frame depends on your trading strategy and style. For example 5, 10 and 15 minutes are the most common time frames for day traders and scalpers. For longer term trading the most usual periods are daily or even weekly time frames.
Candlesticks consists of two parts the body and the wicks
The body of the candle represents the difference between the open and close points. If it is white (or blue/green on a colored chart) the open is the lower boundary of the rectangular body and the price rose during the period you are looking at. If it is black (or red on a colored chart), the opening price is the top boundary and the price fell.
The wicks are the vertical lines that normally stick up from the top and down, from the bottom of the candle body. The top of the upper part of the wick is the highest level that the price ever reached during a time frame. In the same way but from the opposite side the bottom of the lower wick is the lowest price.
The main benefit of candlesticks is that traders can immediately notice whether prices rose or fell over a time frame. A white or green/blue candle indicates a rising price or bullish tendency and a black or red candle indicates a falling price or bearish tendency. Additionally you can easily see how the highest and the lowest price relate to the opening and closing prices.
There are some basic types of candlesticks that if you know how to use them you can take advantage of them and boost your profits in forex trading. The following are the most used:
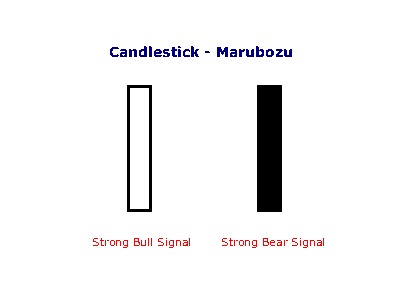
Marubozu pattern
This pattern is a candle that is completely solid, without wicks. In this case, prices never moved lower or higher than their opening and closing positions. If the candle is black or red, the opening price was the high and the closing price was the low. If it is white or green/blue, the opening price was the low and the closing price was the high. This pattern usually indicates a strong trend, bullish if it is white and bearish if it is black.
Doji pattern
In this pattern, the candlestick has no body and is all wick with only a small horizontal bar forming a cross. In this case, the opening and closing points are the same, and the wick shows how far the price went up and down before finding its way back to its opening point at the close. This pattern indicates a reversal from the current trend.
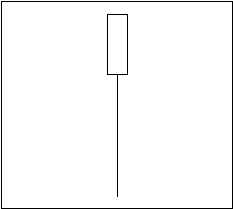
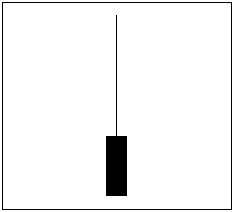
Shaved (Head & Bottom) pattern
The candlestick in this pattern has a long wick and a small body on the upper top (Shaved Head) or the bottom (Shaved Bottom). Additionally the length of the wick should be at least twice the length of the body. This pattern indicates that the market may have shown a Bottom (Shaved Head) or a Top (Shaved Bottom)
The use of candlesticks is a must for most traders in forex market but if you want to develop a consistent and profitable Forex Trading System, candlestick patterns should be used in combination with other indicators. In this way, you will be more confident when you are trading in forex.


Hi, I uncovered your site from twitter and checked out many your other posts. Saved this post.
OMG, how easy it is. Thanks for explanation.
That’s absolutely right. I used the candlestick patterns while developing forex EAs for years.